Reporting
Introduction
The Dashboard contains lots of reporting functionality. This article provides an overview to give you a basic understanding.
Pre-defined reports such as Performance over time are a good place to get started. Once you require more advanced reports click Modify Report (on an existing report) or + Add New Report (from All Reports).
Dashboard
The Dashboard features a range of snapshot views.
The Campaign Performance summary card details the key metrics for your account. Click a metric to adjust the charting to that metric.
It is possible to customise the measures displayed by clicking the settings icon and toggling the metrics on / off.

The Comparison Period can be toggled on/off on this menu also.
All Reports
You can view all your reports under Reports > All Reports. This will include any custom reports that you have saved.

You can favourite and schedule a report by clicking the appropriate icon on the Report Card.
To create a new blank report:

Filters
Report Filters
The quick filters can be used to modify the dates for report:

To modify page level filters, click:

Column Filters
Individual columns can be filtered by clicking on the Filter button at the top left of the data grid.
Select the columns to apply a filter to, choose the operator and enter a value to filter.

Metrics & Dimensions
A report consists of Metrics & Dimensions. You can add as many Metrics and Dimensions to a report as you like. Please note, the more metrics & dimensions you add to a report the more detailed and larger the report will become meaning it will take longer to execute.
You can add / remove Metrics & Dimensions and change their order which affects their column order on the report.

Example Measures: Clicks, Conversions, Cost, Commission, CR% (Conversion Rate).
Example Dimensions: Publisher, Advertiser, Campaign, Device.
Layout
Density
You can adjust the layout of the report data grid by selecting the Density option above the data grid.

Columns
Columns can be added/removed and reordered on the data grid.
To remove columns click on the Columns option above the data grid and switch the relevant columns on / off.
To reorder columns click on the column header, drag to the new location and drop.
Custom Reports
To create a custom report:
- Go to All Reports > Add New Report.
- Set the Metrics & Dimensions to show on the report.
- Set the Filters.
- Set your chart type.
- Click Save.
- Set the visibility:
- Shared - this is available to all users in the account you are logged into.
- Private - this is only visible to you.
- Add a name and description.
- Click Save Report
- The report will now be visible as a Card under All Reports.
Scheduling Reports
Some reports can be scheduled to be delivered via email or to and FTP server.

To create a scheduled report:
- Navigate to Reports > Tools > Scheduled Reports.
- Click the button to create a new schedule.
- Select the report to send - this could be a predefined report or one of your saved reports.
- Select the frequency to send the report (E.g., daily or weekly).
- Enter the Dates you want the report to be delivered between.
- Select the Date Range for which you want the report to run each execution.
- Select Email or FTP as how you want to receive your report.
- Enter the recipients. Separate multiple emails with a
;. - Add a subject and some content for the email that will be sent with the .
- Select the format of the file to receive. CSV will be the most common format that can be viewed in Excel.
Exporting
You can export a report as:
- CSV - Useful for opening in Excel.
- JSON - Useful for loading data into an external database.
- XML - Useful for loading data into an external database.
To export a report click the following icon and select your output type from the menu:
![]()
To export a chart click the following icon:
![]()
Favourite Reports
Make it easy to access your most commonly used reports by favouriting them so they appear at the top of the All Reports page:

On the Navigation drawer:

To Favourite a report click on the star icon:
![]()
This can include custom reports that you have saved.
Currency
It is possible to convert Commission & Cost values into any currency on the reports. Simply select the currency to convert to from the below select list:

Commissions will be converted in-line. The Conversion will use the current day's mid-point rate. You can show additional columns to view the original and converted value side-by-side.
Alerts
The Dashboard enables a user to create an Alert against a report KPI and to be notified through multiple channels.
Alerts are unique to a user. You will not be able to see or create alerts on behalf of other users. This is intended as an anti-spam control. If a user requires an Alert they will need to create it under their own user account.
Create a new Alert

- Navigate to Reports > Tools > Alerts.
- Click the button to create a new Alert.
- Select Reporting Alert.
- Select the Campaign to be alerted against.
- Select a Publisher (if relevant).
- Select the Metric to check (E.g., Clicks, Conversions, Commission).
- Select the Comparison (E.g., Greater than, Less than).
- Select the check schedule. This will define how often the Alert check runs and the frequency on which you may receive Alerts. it also the defines the period over which the check takes place (E.g., if the check is > 100 clicks with a weekly schedule, it will Alert once 100 clicks have been exceeded within a week time-frame once a week).
- Choose how you want to be notified:
- UI - Send a notification in the interface of the Dashboard.
- Email - Send an email to your saved email address for the currently logged in user.
- Slack - Connect the Optimise Slack App to send notifications via Slack.
- Teams - Connect the Optimise Teams App to send notifications via Microsoft Teams.
Update an Alert
- Navigate to Reports > Tools > Alerts.
- Click on either EDIT icon to update the schedule settings or click the DELETE icon to remove the schedule completely.
Slack Alerts
Alerts can be sent directly to a channel in Slack.
Go to your Profile:
-
Click on the Profile icon in the top right corner.
-
Click Settings.
-
Click the Add to Slack Button:

-
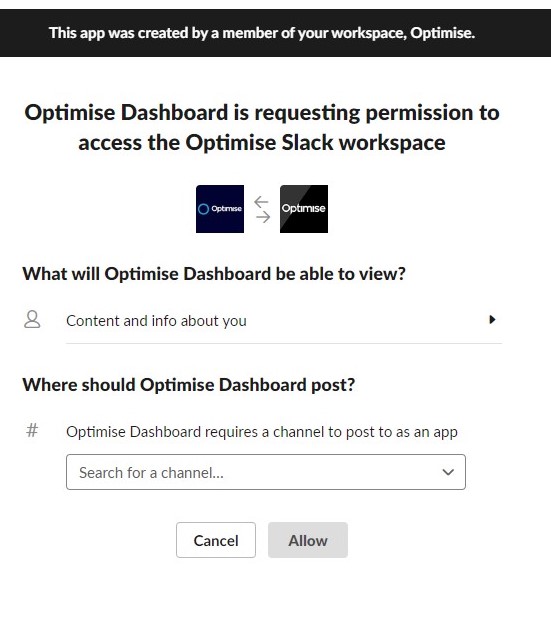
In the popup select the channel to send Alerts to and approve the permissions:
Microsoft Teams Alerts
Alerts can be sent directly to MS Teams via the Optimise MS Teams Bot.
Annotations (Labs)
It is possible to add an Annotation to the reports that will be displayed on the charts. This allows you to describe and flag certain trends and events within the Dashboard charts.
Create a new Annotation

- Select Reports > Tools > Annotations.
- Click the button to get started.
- Most annotations will apply to a specific date so choose Custom and select the date to apply the annotation to.
- Select the Campaign and if applicable the Publisher. If you select a Publisher this will limit the visibility of the Annotation.
- Select one of the predefined Annotation Titles and add some text to be displayed alongside your Annotation.
Viewing an Annotation
Navigate to a report and locate the chart.
Editing An Annotation
- Select Reports > Tools > Annotations.
- Find the Annotation you want to edit (you may need to change the date filter at the top left).
- Click the Edit icon and make the relevant changes.